Latest news
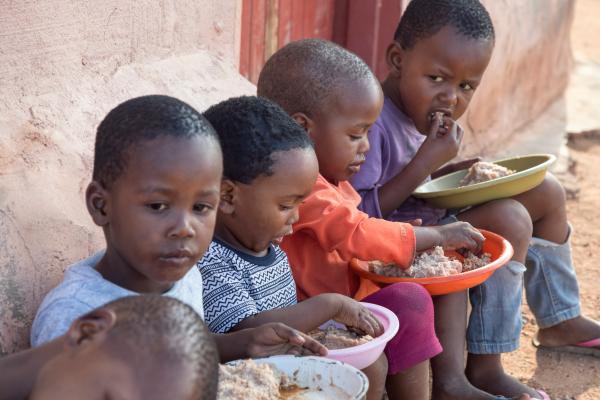
The Global Report on Food Crises identifies conflicts as major driver, and the Gaza Strip food crisis as the worst in eight years.
A harmonised approach is a first step in eventually establishing exposure levels in EU tap water.
First 10 manufacturers commit to develop interoperable connected products within a year.
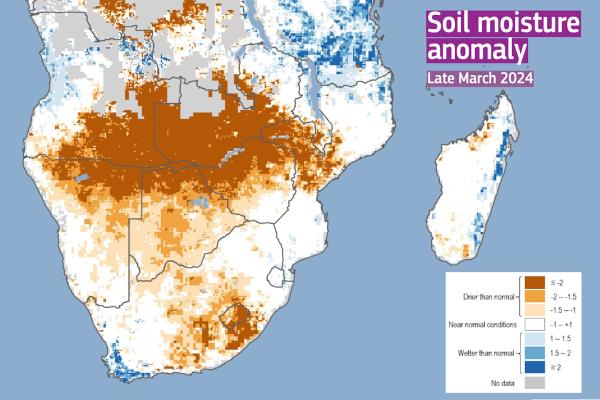
Zimbabwe, Zambia, and Malawi have officially declared state of emergency.
What we do
Our science and knowledge activities clustered into 33 portfolios that support the 6 Commission priorities for 2019-24.
JRC Publications Repository: Science-for-Policy reports, articles, technical reports and other scientific outputs.
Technology transfer, innovation and knowledge management. Access to our research infrastructures, scientific tools and trainings.
Worldwide partnerships, international collaborations and scientific networks. Find out about vacancies and opportunities to work with us.
When policymakers create laws that affect millions of Europeans, how can they be confident that these laws will help people live better and safely? What source of information can they rely on? Who can they trust?
Scientists of the European Commission’s Joint Research Centre (JRC) carry out research in various fields to provide independent advice to EU policymakers and put science at the heart of European policies.
We are working every day to make European policies grounded in science.
In focus